This function download Global HBV Parameter Maps created by Beck et al. (2020) and crop it to the shapefile boundaries. See GloH2O website for details.
Arguments
- AOI
SpatVector. A polygon layer with area of interest.
- folds
Numeric. A numeric vector from 1 to 10 indicating the folds numbers to process.
- mean
Logical. If TRUE, return mean zonal statistics, calculated using
globalmethod from terra package- warp
Logical. If TRUE, reproject the HBV rasters to
AOIprojection- version
Character. Can be used to determine the dataset version. Must be one of "v0.8" (original release from February 5, 2020) or "v0.9" (revised version from May 5, 2020). See details.
Details
Version history (according to GloH2O website):
- V0.9 (May 5, 2022)
To avoid local minima, the authors reduced the number of predictors to three and increased the number of generations to 2000. A selection was made based on which predictors individually provided the best training score: snowfall fraction of precipitation (
FSNOW), mean topographic slope (SLOPE), and soil clay content (CLAY). Increasing the number of generations to 2000 allowed the algorithm to find the true optimum, while lowering the spatial resolution from 0.05° to 0.1° reduced computational requirements.- V0.8 (February 5, 2020)
Original release corresponding to Beck et al. (2020).
References
Beck HE, Pan M, Lin P, Seibert J, van Dijk AIJM, Wood EF. 2020. Global Fully Distributed Parameter Regionalization Based on Observed Streamflow From 4,229 Headwater Catchments. Journal of Geophysical Research: Atmospheres 125 : e2019JD031485. DOI: 10.1029/2019JD031485
Examples
# Load shapefile
f <- system.file("ex/lux.shp", package="terra")
v <- vect(f)
# Get zonal statisitcs
fold1_mean <- hbv_get_parameters(v, folds = 1, mean = TRUE, warp = FALSE)
#> Downloading rasters...
#> Loading required namespace: pbapply
#> Cropping rasters...
fold1_mean
#> $fold_0
#> mean
#> BETA 3.59133975
#> CET 0.00000000
#> CFMAX 4.76274042
#> CFR 0.02329523
#> CWH 0.03688424
#> FC 557.79513737
#> K0 0.11312447
#> K1 0.22010622
#> K2 0.14379373
#> LP 0.78630368
#> MAXBAS 1.80986611
#> PCORR 1.00000000
#> PERC 3.55778855
#> SFCF 1.00000000
#> TT -0.06733536
#> UZL 56.14696222
#>
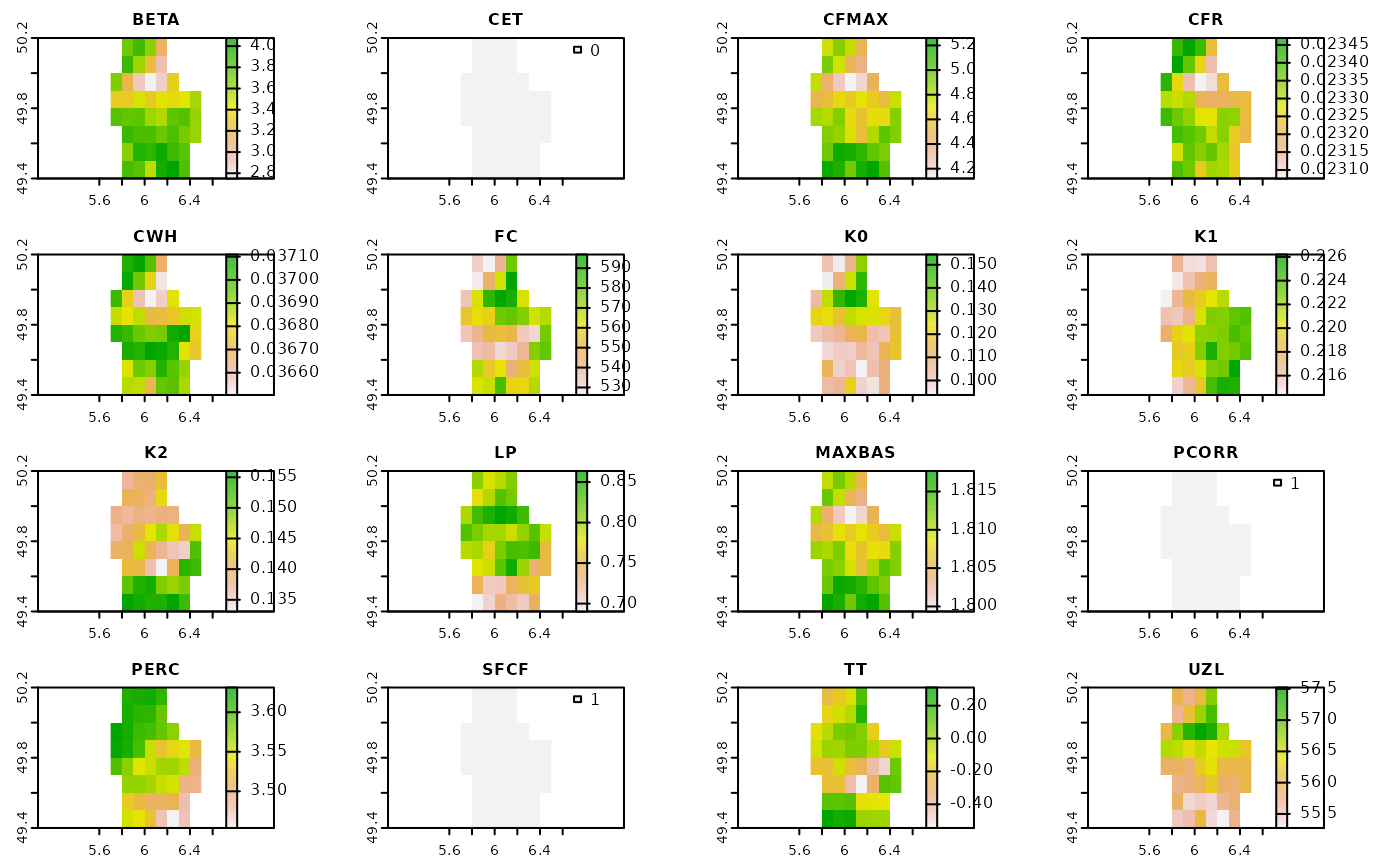
# Get rasters
fold1_raster <- hbv_get_parameters(v, folds = 1, mean = FALSE, warp = FALSE)
#> Downloading rasters...
#> Cropping rasters...
plot(fold1_raster[[1]])