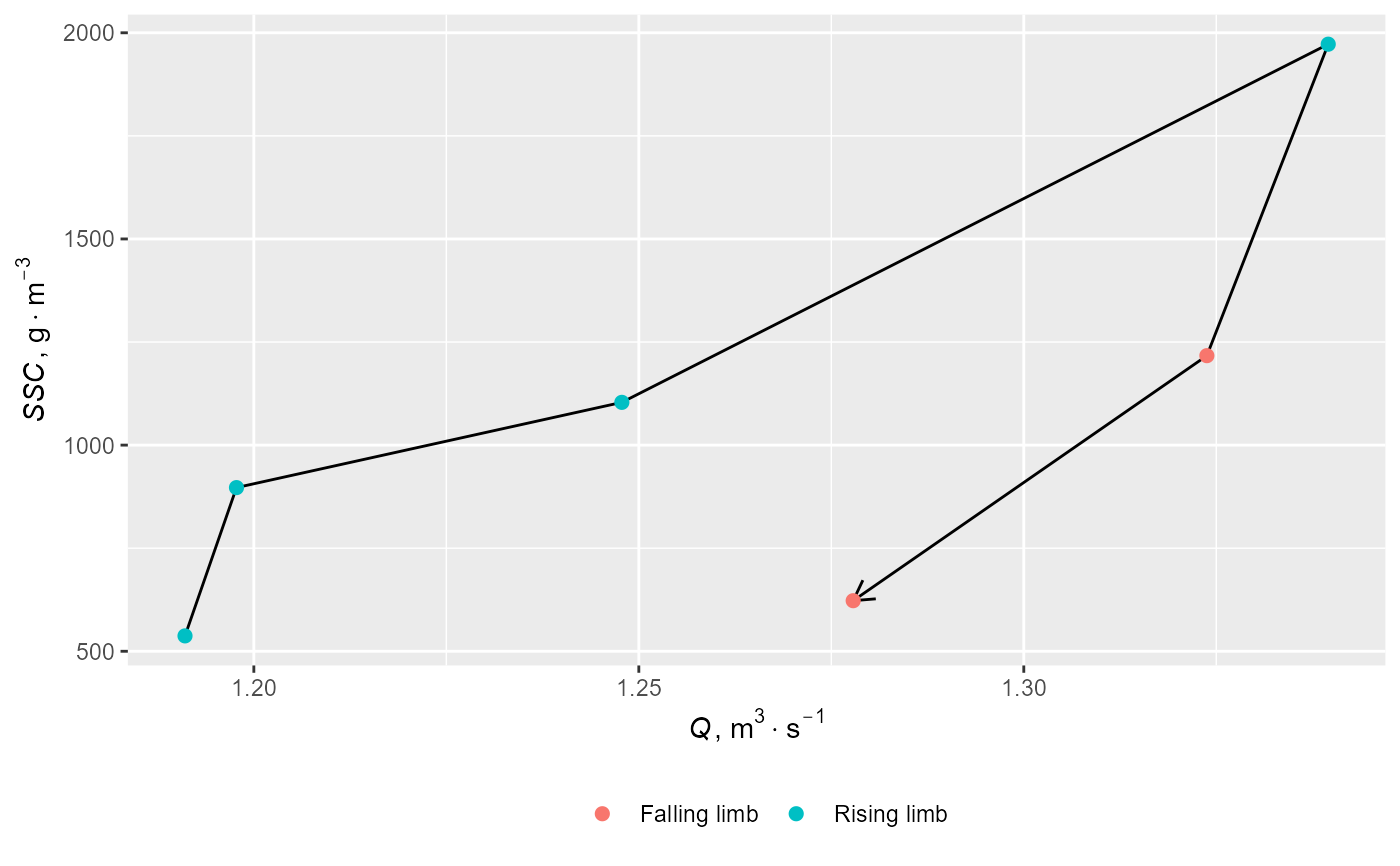
This function plots a water discharge (Q) and suspended
sediment concentration (SSC) relationship.
hysteresis_plot(
  dataframe,
  datetime,
  q,
  ssc,
  base_font_size = 12,
  legend = "bottom",
  ...
)
Arguments
- dataframe
A data set object
- datetime
Datetime variable (column in POSIXct format), optional
- q
Water discharge variable (or water stage)
- ssc
Suspended sediment concentration variable
- base_font_size
Font size (numeric, 12 by default)
- legend
the position of legends ("none", "left", "right", "bottom", "top", or two-element numeric vector)
- ...
Other arguments passed to
ggpubr::theme_pubclean
Value
A ggplot2 object
