The loadflux package is build for the comprehensive analysis of the intra-event suspended sediment dynamics.
Installation
You can install the development version from GitHub with:
# install.packages("devtools")
devtools::install_github("atsyplenkov/loadflux")
Example
This is a basic example which shows you how to split your series into hydrological events:
library(dplyr)
library(loadflux)
data(djan)

df <- djan %>%
  hydro_events(q = discharge,
               datetime = time,
               window = 21)

head(df)
#> # A tibble: 6 × 4
#>      he time                discharge    SS
#>   <dbl> <dttm>                  <dbl> <dbl>
#> 1     1 2017-06-06 12:00:00     0.778  227.
#> 2     1 2017-06-06 13:00:00     0.778   NA
#> 3     1 2017-06-06 14:00:00     0.778  224.
#> 4     1 2017-06-06 15:00:00     0.778   NA
#> 5     1 2017-06-06 16:00:00     0.778  271.
#> 6     1 2017-06-06 17:00:00     0.925   NA
Plots
Then you can plot the hysteresis loop by running hysteresis_plot
library(ggplot2)

df %>%
  filter(he == 2) %>%
  hysteresis_plot(q = discharge,
                  ssc = SS,
                  base_font_size = 14)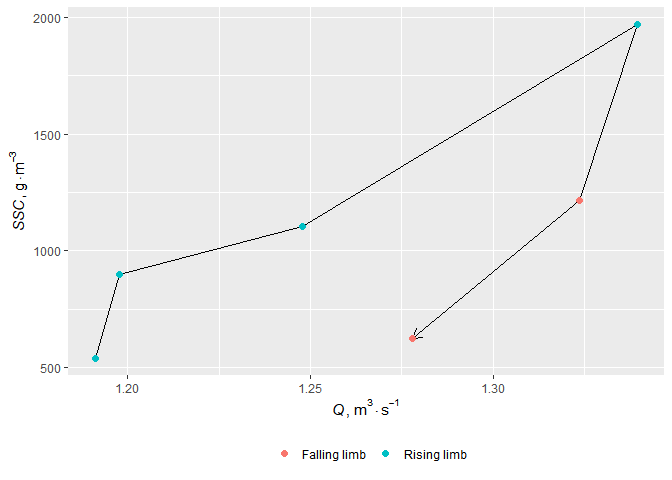
Hyseteresis indexes
This package also contains several function for hysteresis index calculation:
Added
-
SHI- Simple Hystersis Index from Tsyplenkov et al., 2020 -
AHI- Aich’s Hysteresis Index from Aich et al., 2014
Pending
-
HImid- Hysteresis Index from Lawler et al., 2006
To calculate a hysteresis index for your event run as follows:
